
The current mixing of people cycling on Byres Road with motor vehicles creates inevitable conflict and harm. The large differences in speed, mass and size means the more vulnerable road user comes off far worse.
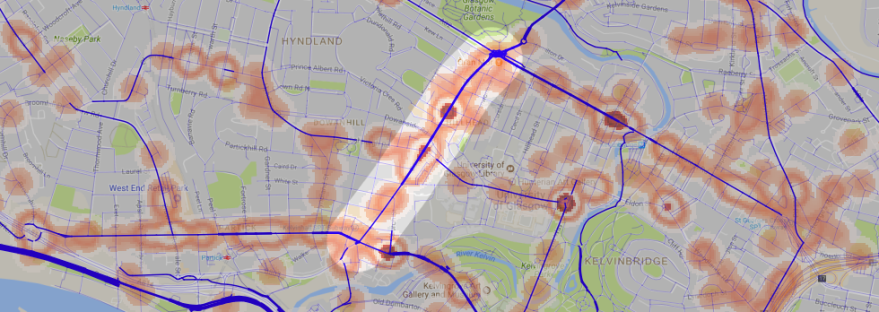
We can look back over historical incidents to check for hotspots and compare with the general pattern in Glasgow. The data we’re using came from all instances of when someone cycling was involved in an incident to which the police were called between 1999 to 2013 (STATS19).
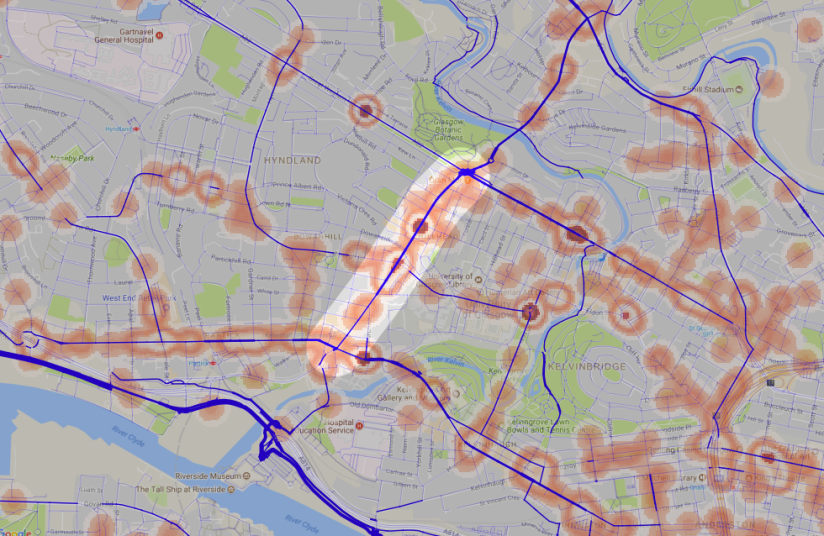
If we also use STRAVA data we can see Byres Road has a moderate amount of cycling use, yet has one of the highest accident rates. The thicker the width of the purple lines the greater usage. There’s something about Byres Road that makes it especially dangerous.
To put this in a broader context, here’s a map of the centre and NW of the city.
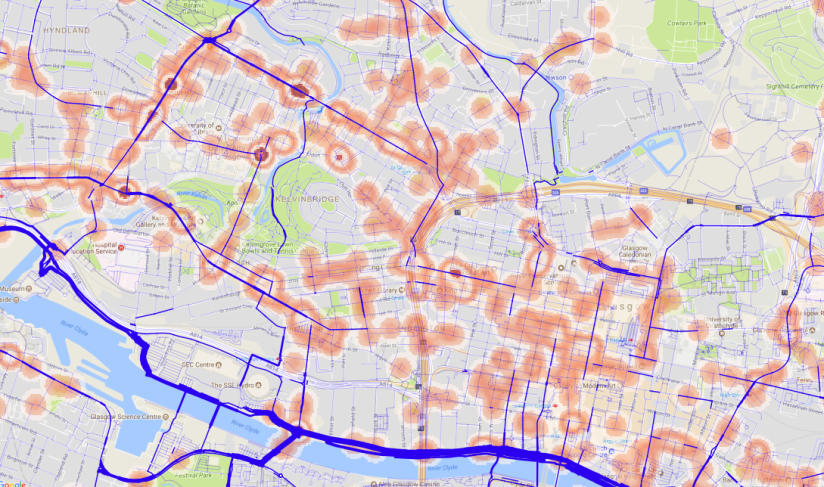
It’s clear the West of the city has the worst incident hotspots, many of which are along Byres Road itself. Looking at the photo below you might get a sense of why.
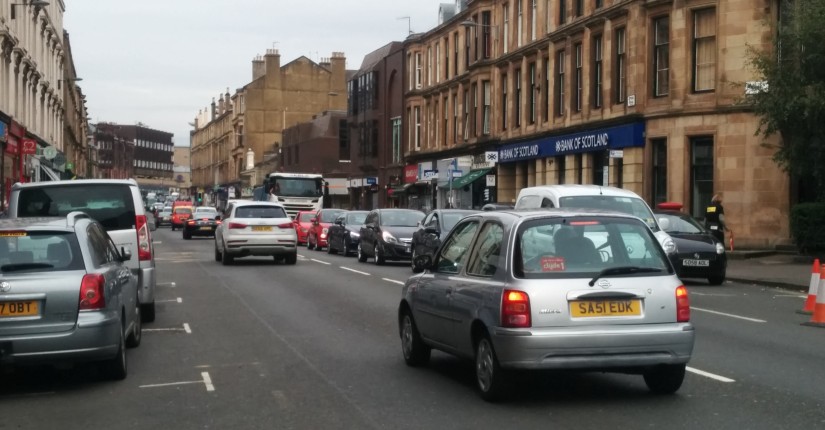
For someone cycling down this road it’s a very complex environment: Drivers trying to rush through, car doors suddenly opening, cars pulling in and out of parking spots, people trying to walk across the street, people weaving in-between traffic jams, the list goes on. For everyone involved it can be difficult to know where you expect different road users.
For Byres Road to be safe and feel safe to cycle, either motor vehicle volumes need to be reduced to very low levels, using measures like bus gates, or cycling is physically separated, just like we do with walking on pavements. Space for People Byres Road developed designs to remove conflict and make it easier for everyone to navigate safely.

3 thoughts on “The Avenue of Accidents”